Start with the business decision.
Each page states the management question before showing the data.
Research
Actionable Insight Reports turn public trade and input-output data into compact management screens: what is exposed, why it matters, what the charts actually say, and which client-specific diligence step should come next.
Published Actionable Insight Reports
Each page states the management question before showing the data.
Visuals are designed to prioritize where diligence is needed, not to overclaim.
The next step is always an HTS, supplier, BOM, contract, or operating review.
A structural screen of robots, vision systems, navigation hardware, sensors, controls, power electronics, and actuation products that support physical-AI deployment.
Prioritize which hardware lanes require supplier qualification, spares planning, safety review, and monitoring before embodied-AI deployments scale.
A public-data screen of AI chips, compute systems, semiconductor inputs, fabrication equipment, supplier platforms, and downstream U.S. IO footprint.
Separate chip, compute-unit, wafer-input, fabrication-equipment, and test-equipment risks before making sourcing or export-control claims.
A structural screen of China-origin rare-earth focus flows, downstream value-added exposure, substitution candidates, and market-transition constraints.
Distinguish direct import exposure from downstream manufacturing footprint and the bottlenecks that constrain supplier switching.
Where 2024-2026 Section 301 actions change U.S. sourcing, cash flow, and supplier resilience.
Identify tariff-sensitive product nodes and decide whether to pursue price protection, supplier qualification, or continued monitoring.
Visualization preview
The research page shows a small sample of the report visuals so clients can understand the analytical object before opening a PDF.
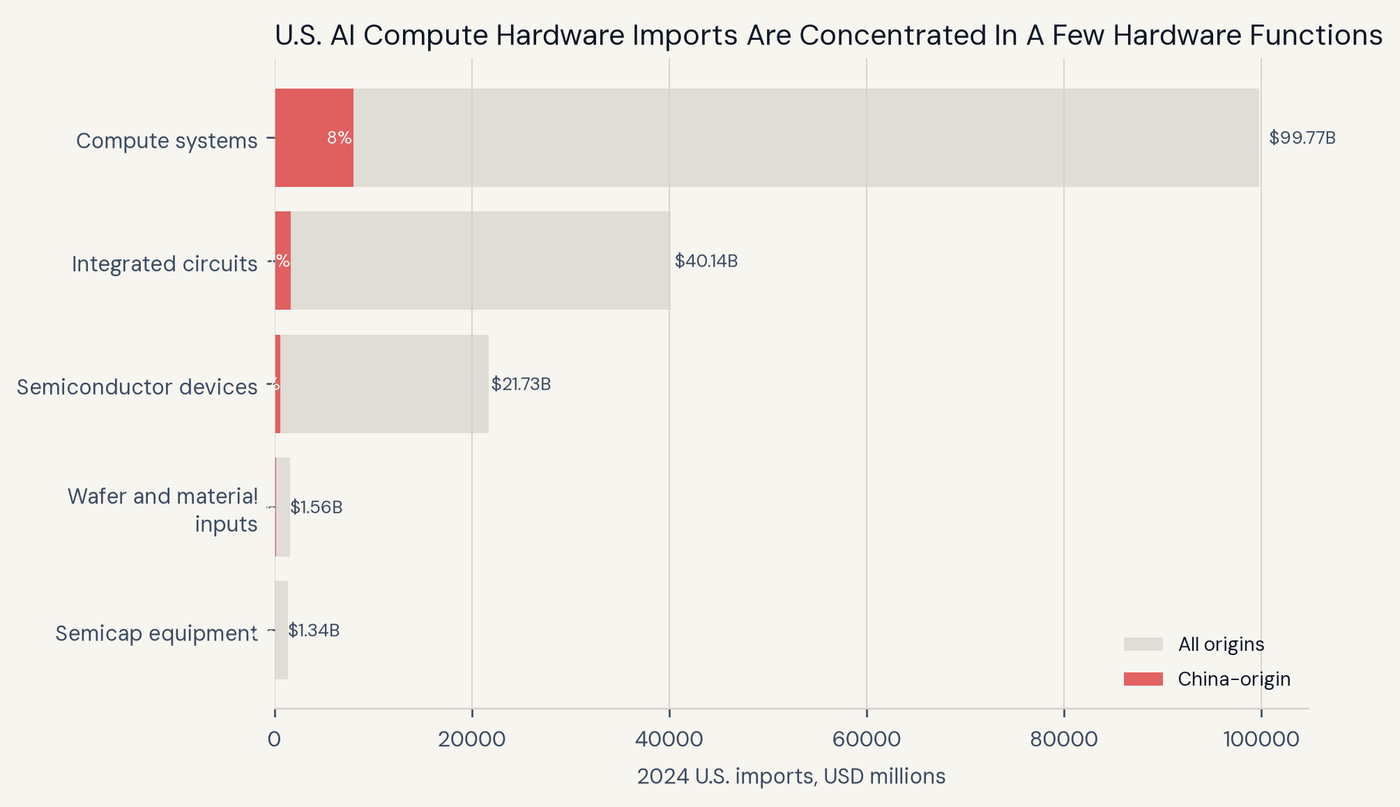 AI compute exposure
Separates compute systems, ICs, semicap equipment, and other hardware functions before discussing China exposure.
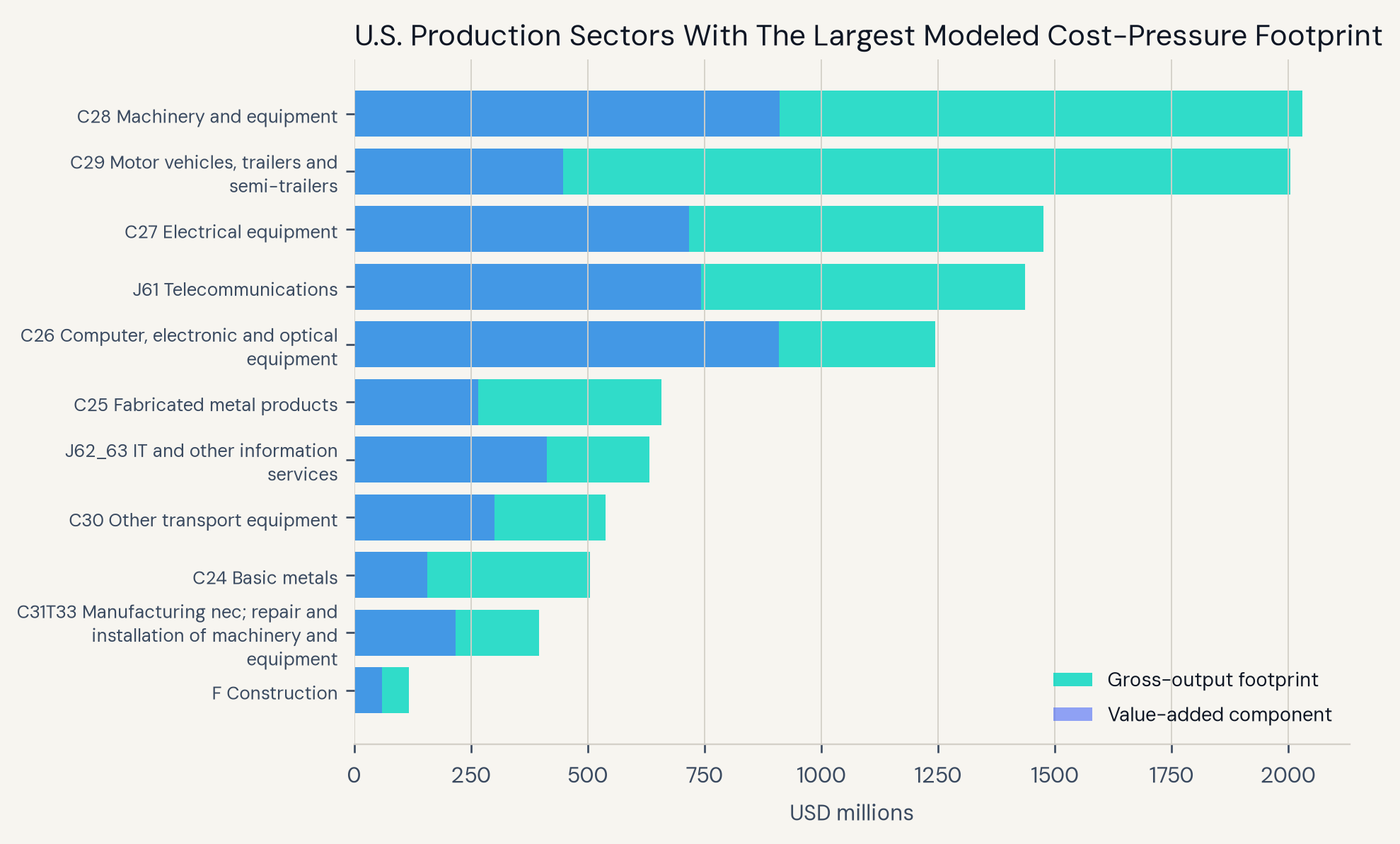 Physical AI footprint
Turns direct China-origin hardware flows into a production-network incidence screen for downstream sectors.
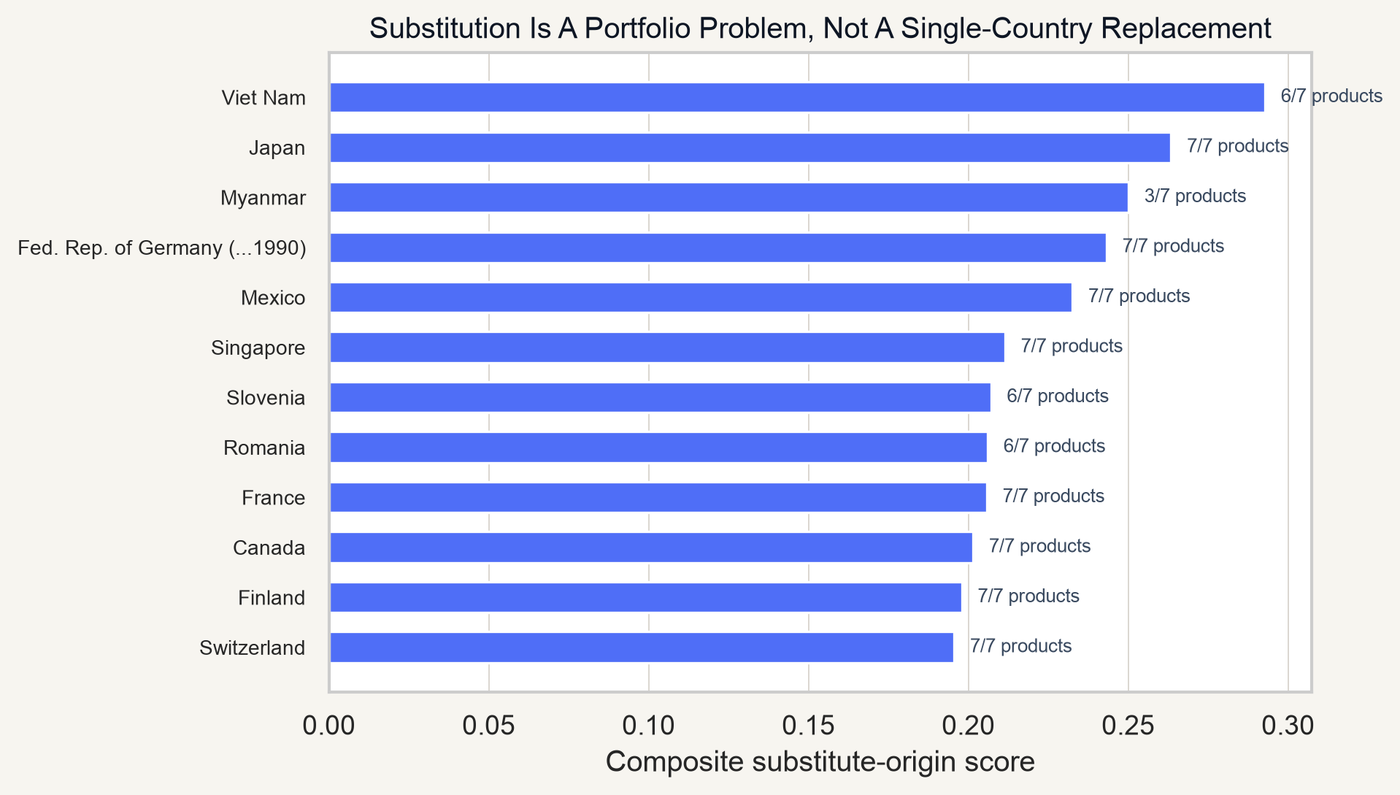 Substitution screen
Ranks trade-platform visibility while keeping the limitation clear: capacity, qualification, and customer approval remain client-specific.
Method discipline
Each AIR states what the HS6 proxy captures and what it cannot identify.
Published claims are tied back to the report data and claim ledgers.
Screening estimates are kept separate from legal liability, revenue forecasts, or approved supplier claims.
Every report ends with the operational data needed to convert the screen into a decision.
Research agenda
The public library will continue to emphasize network exposure, sourcing constraints, trade-policy change, and financing pressure.
Where concentration appears below the first tier of procurement.
How payment terms and financing conditions affect supplier resilience.
How to interpret shifts in lead times, supplier behavior, and policy signals.