
U.S.–China Strategic Tariff Exposure Radar
AIR 001
Independent, self-funded research. Trade: CEPII BACI; production: OECD ICIO; policy: primary notices.Independent, self-funded research.
ContactConcentrated Chinese input supply and European export exposure create different pressures. AIR 005 maps the trade, legal measures and production-cost channels that matter for sourcing and sales decisions.
China–Europe Trade Conflict
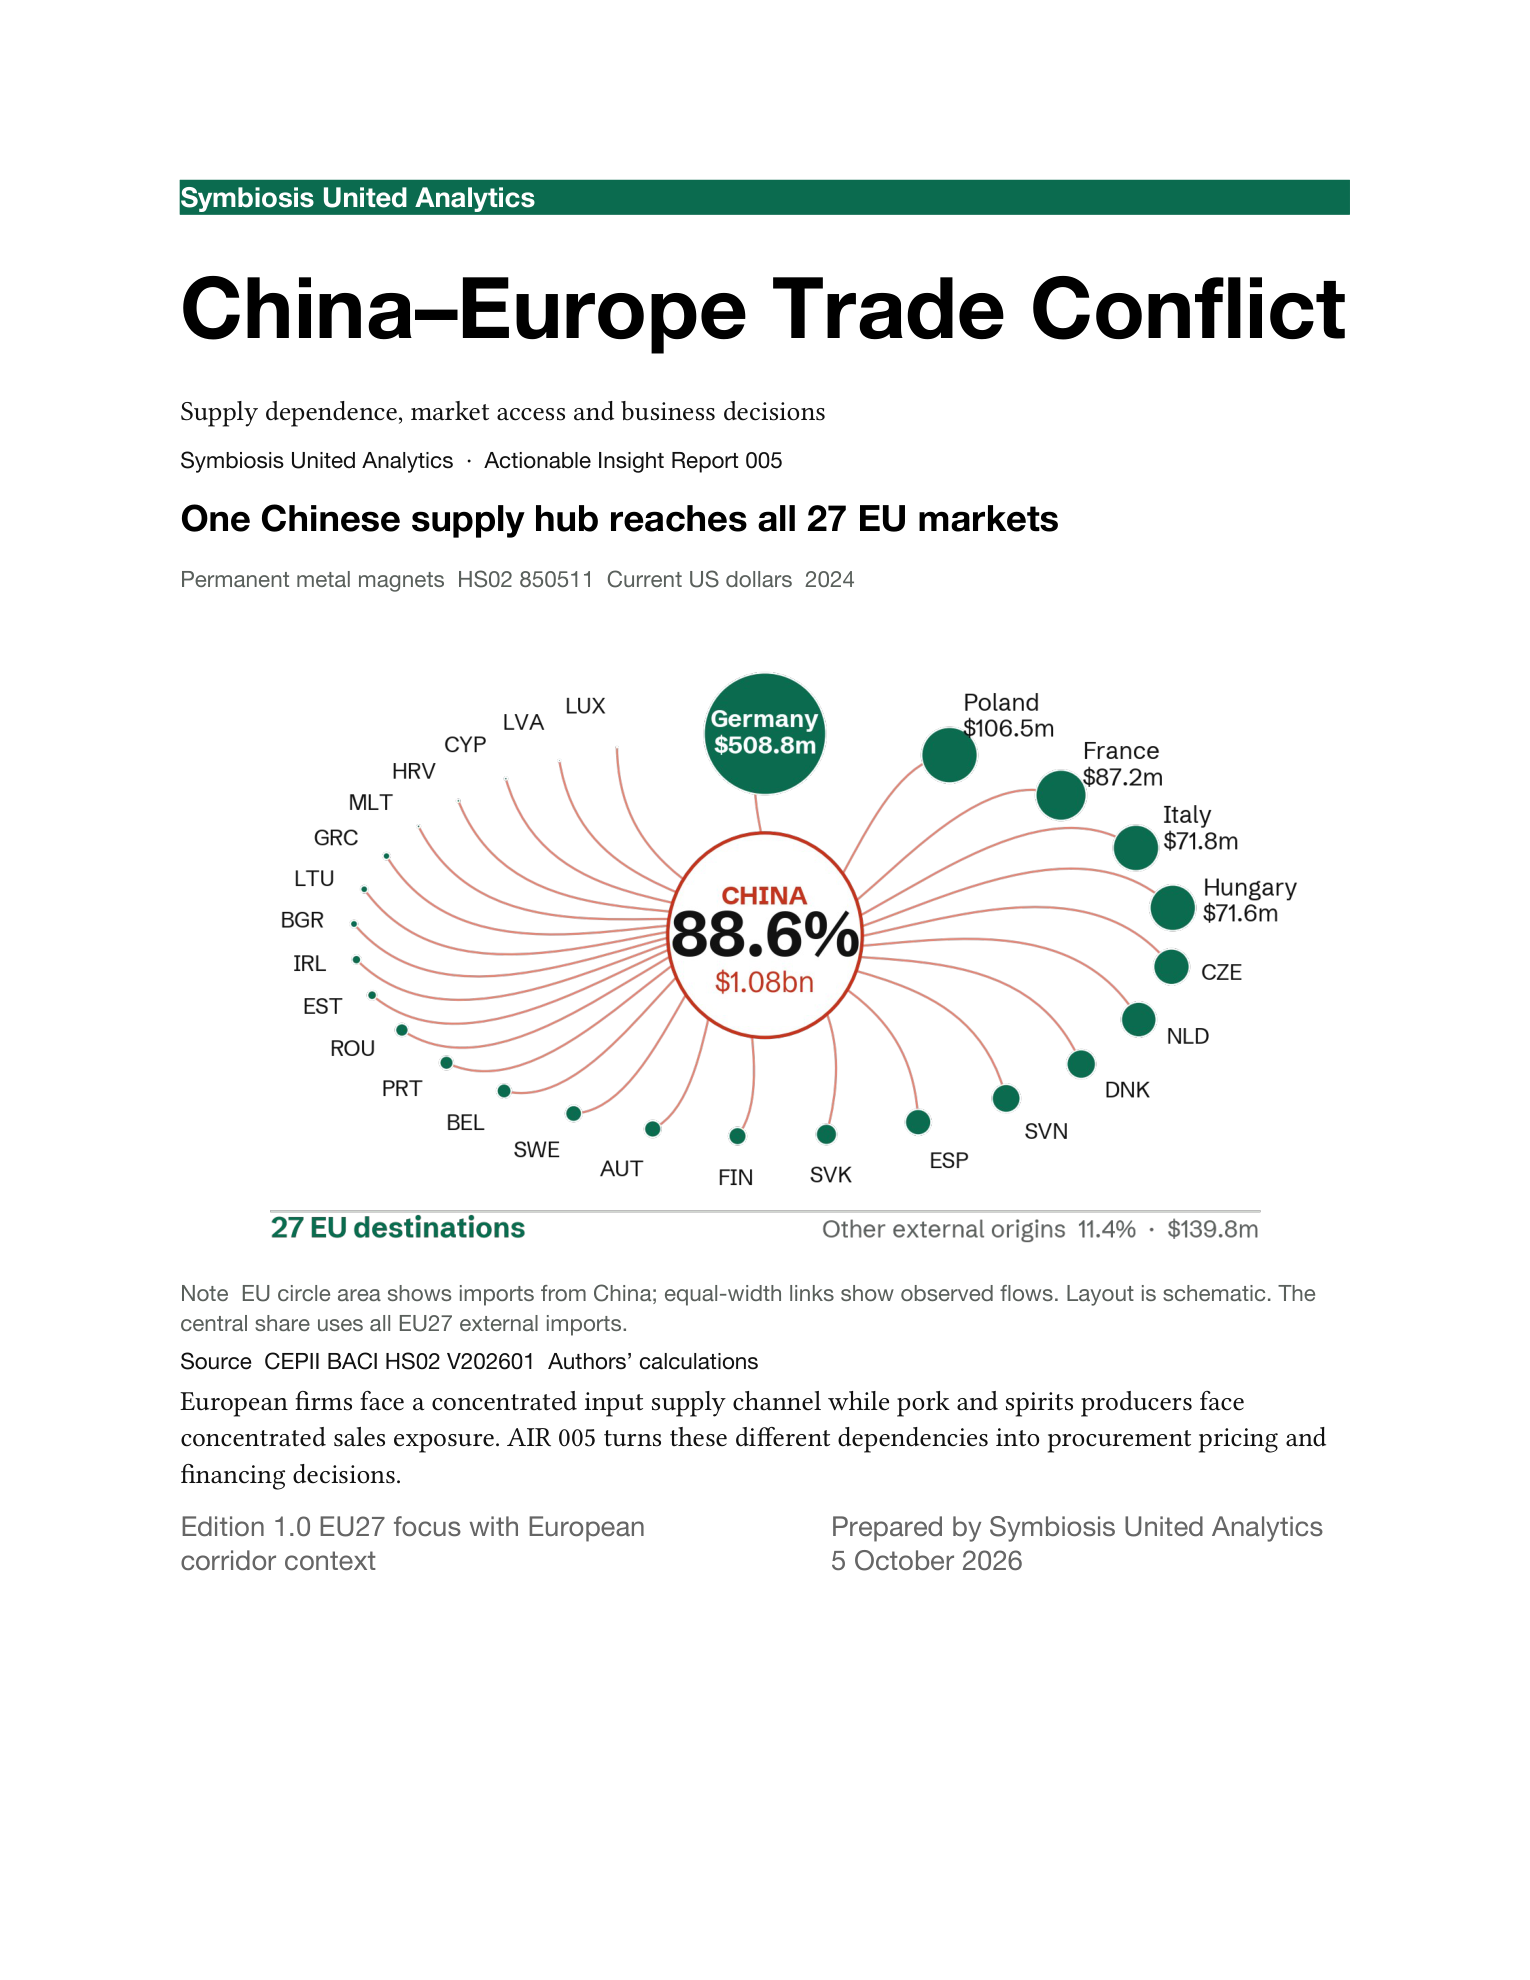
One origin reaches all 27 EU destinations
Exhibit 1. Permanent metal magnets (HS02 850511), 2024; destination area = imports from China

Note: Centre share uses all EU external magnet imports. Equal-width links show observed flows; positions are schematic. Areas encode values, not production capacity or chemistry.
Source: CEPII BACI HS02 (V202601); Symbiosis United Analytics.
Explore the interactive magnet network
In 2024, the fixed EU27 imports $627.1 billion from China and exports $243.8 billion in return. The UK is excluded throughout; these current-dollar BACI series are kept separate from Eurostat euro statistics.
Duties, price undertakings, licensing and procurement restrictions change market access. A product register must connect tariff classification, producer/exporter rate, accepted undertaking and license status. Legal scope is narrower than these historical trade baskets.
Goods imports from China remain more than twice the reverse flow
Exhibit 2. All goods, fixed EU27, 2005–2024, current US$ billions

Note: BACI reconciles exporter and importer reports. Do not splice these USD series to Eurostat euro customs totals.
Source: CEPII BACI HS02 (V202601); Symbiosis United Analytics.
External-import concentration is not dependence in total EU consumption: EU production and intra-EU trade are outside the denominator. Non-Chinese external metal-magnet imports total $139.8 million in 2024. That historical flow does not measure immediately available replacement capacity.
Magnets and accumulator proxies have the highest China shares
Exhibit 3. China-origin share of EU external imports, selected HS02 baskets, 2024, percent

Note: External imports exclude intra-EU trade; this is not a share of EU consumption. HS02 870390 is not EV-only, 850780 not lithium-ion-only, and 854140 not solar-only.
Source: CEPII BACI HS02 (V202601); Symbiosis United Analytics.
Sales exposure is concentrated in different countries. Spain accounts for 47.7% of EU pork-proxy exports to China; France accounts for 98.9% of grape-spirit exports. Exporters need a rate and contract register, margin-sharing decisions and alternative market qualification.
China absorbs a quarter of the EU pork-proxy export market
Exhibit 4. Exports to China as share of EU external exports, selected HS02 baskets, 2024, percent

Note: Pork, dairy and spirits baskets over-cover some legal product scopes; values are descriptive trade screens, not duty liabilities.
Source: CEPII BACI HS02 (V202601); Symbiosis United Analytics.
The sensitivity holds sourcing, quantities, value-added costs and markups fixed. The shock affects directly purchased Chinese intermediates and propagates only through EU production. It does not predict output, employment, inflation or welfare, or identify the effect of BEV tariffs.
Electronics has the largest modelled cost response in the screen
Exhibit 5. Hypothetical 10% increase in Chinese direct intermediate-input prices; cost change, percent

Note: OECD ICIO 2020. Fixed sourcing, quantities, value-added costs and markups; EU propagation only. Price-cost sensitivity, not a forecast or a causal tariff estimate.
Source: OECD ICIO, 2023 edition (2020 table); Symbiosis United Analytics.
Connect origin, exporter, applicable rate, undertaking and renewal date in the customs and contract register.
Check magnet specification, chemistry, certification and lead time before reallocating orders.
Separate the duty invoice from contract pricing, then assess funding against eligible customs value and inventory days.
This independent public research was self-funded and was not commissioned or funded by a company, government or client.
Symbiosis United Analytics (2026). China–Europe Trade Conflict. Actionable Insight Report 005, edition 1.0. https://symbiosisunited.com/research/air-005/
@techreport{sua2026air005,
 author = {{Symbiosis United Analytics}},
 title = {China–Europe Trade Conflict},
 institution = {Symbiosis United Analytics},
 number = {005}, year = {2026}, month = oct,
 note = {Edition 1.0},
 url = {https://symbiosisunited.com/research/air-005/}
}Download public aggregates (12 CSVs, source register and methods)
We apply the methods behind this research to an organisation's own question, from an exposure screen to a decision memo. How we work with clients, or get in touch.