
Our approach
Research standards
Every report should let a reader see what was measured, how, from which sources, and where the evidence stops. These are the standards we hold our research to.
Data sources
We build on public, citable data sets and record the release used in every exhibit's source line.
| Source | What it covers | How we use it |
|---|---|---|
| CEPII BACI, HS 2002 classification (release V202601) | Reconciled bilateral trade flows for some 5,000 six-digit (HS6) products | U.S. imports by product and origin; China's share over time (AIR 001–004) |
| OECD Inter-Country Input-Output tables, 2023 edition (2020 table) | Flows of goods and services between industries and countries | Modelled downstream footprint and value added of China-origin imports (AIR 002–004) |
| USTR notices in the Federal Register, 89 FR 76581 and 89 FR 101682 | Section 301 tariff modifications on imports from China, 2024–2026 | Products in scope, final rates and effective years (AIR 001) |
Research pipeline
Human judgment, machine analysis
Each step has a clear division of labour: people make the choices that need judgment; computation applies them completely and reproducibly.
Source
People choose data sets that fit the question; code ingests the full release and records its version.
Map
People define the scope — which HS6 products stand for a technology or a tariff list. Code applies the definition to every origin and year.
Test
Every published figure is recomputed from the derived data and checked against the text and exhibits. Benchmarks test whether a pattern holds beyond the screen.
Interpret
People decide what the evidence means for a decision, and state where it stops.
Update
When new data or a correction changes a finding, we publish a new dated edition.
Exhibit standards
Charts that state their finding
The title is the finding.
Each exhibit title is a sentence that says what the chart shows, followed by a line giving the units and period.
Every exhibit has a source.
Source and note lines name the data release and any definition a reader needs.
One colour, one meaning.
Red is reserved for China-origin flows; grey is context; green marks the series in focus.
Readable without the chart.
Each chart has a text description ending in its takeaway; the Explorer publishes the data table behind every view.
Editions and corrections
Dated, versioned, corrected in the open
Each report carries an edition number and a publication date, shown on its page and in its citation. If a correction changes a number or a finding, we publish a new edition and describe the change on the report page.
To report a possible error, contact us with the report code and the page or exhibit concerned.
How to read our charts
Every image is a chart
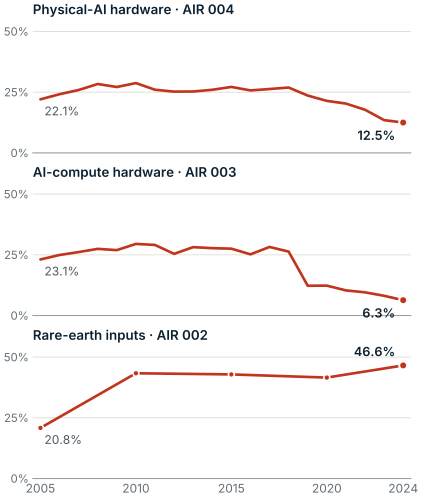
We do not use stock photography or illustration. Every image on this site is a chart drawn by code from the same data as our reports, and can be checked like any exhibit.
- Red
- China. A red line or bar always shows China-origin imports or China's share of them.
- Grey
- The comparison: all other origins, or all other products.
- One scale
- Charts shown side by side share one axis, so their heights can be compared directly.
- Dots
- A dot on every point means the series has sampled years only, as in AIR 002.
The exact figures, notes and sources are in each report's exhibits and in the Explorer.
Limitations
Where the evidence stops
- Product proxies. HS6 codes are broader than the technologies or legal tariff lines they stand for.
- Origin is the exporting country. Customs data do not show where value was added or who owns the supplier; assembly and transshipment are not separated.
- Industry-level models. Input-output footprints use 2020 tables and show where exposure travels between industries, not firm-level dependence.
- Screens, not forecasts. Our reports rank exposure for diligence; they do not predict prices, flows or policy.
- Reporting codes. BACI reports some flows under “Other Asia, n.e.s.”, a code commonly used for Taiwan.